View Apex Debug Logs Locally
Tired of having to go to the Developer Console just to see your logs? Follow these steps to get your debug logs showing up in your local terminal, a VS Code tab, or even a local file.
The tl;dr
The History
Developing in Salesforce has always been a bit different from other technologies. Something that can be quite frustrating to newcomers is the lack of localhost. While you can write Apex code locally on your machine, you can't run it locally.
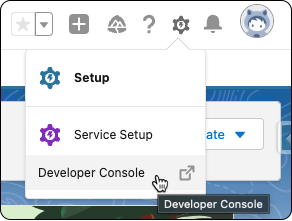
This difference becomes very apparent the first time you want to view your debug logs. For years, the only option was to open up the horribly outdated "Developer Console" (gear icon > Developer Console).
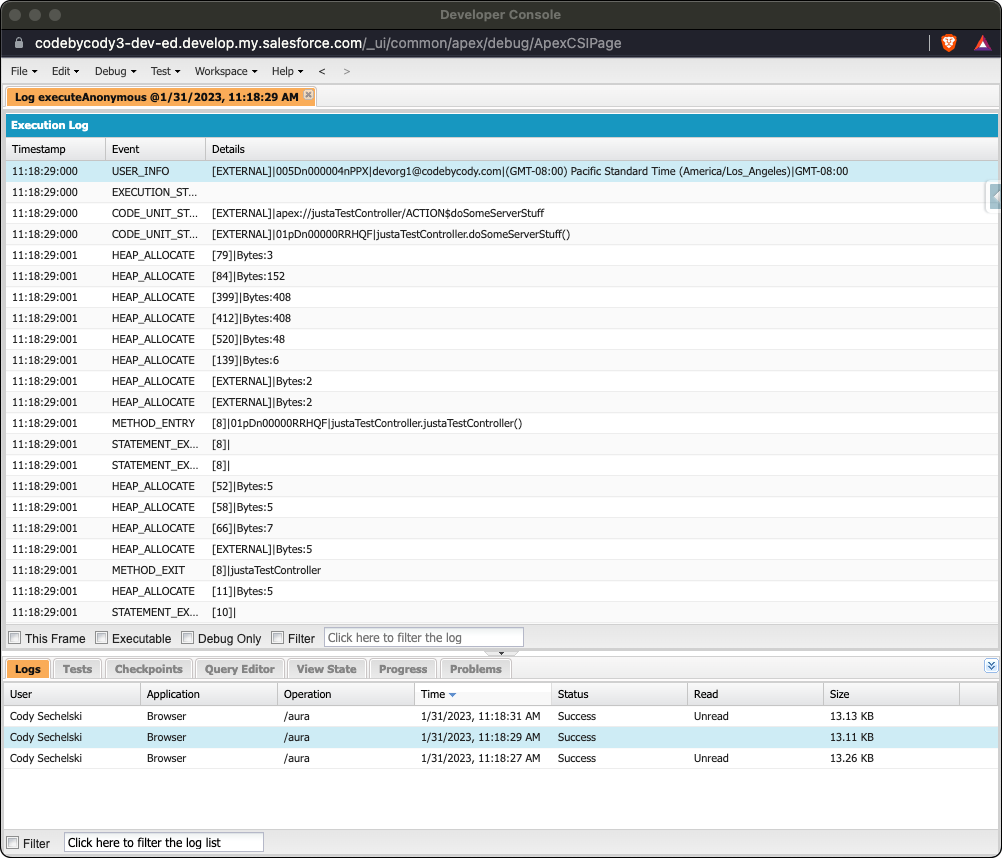
Despite the early 2000-ish UI, the Developer Console does do a decent job of showing you your log output.
Problems with the Developer Console
My biggest pet peeve is simply that I have to open another window. When I am slinging code, I tend to get into a flow. Write some code, ctrl+shift+p, deploy to server, rinse and, repeat. The only time I leave my editor is to test out whatever I'm building in the UI. So I hate opening up the Dev Console to view logs because just that small act really disrupts my flow.
My personal preferences aside, there are some demonstrable shortcomings with the Dev Console's Log Viewer.
They are hard to read and search
The Log Viewer separates each line into what is basically a table row and there is no native search tool. The browser's ctrl+f feature, kind of helps but it seems inconsistent. The "Filter" option works well, but it just filters the lines (table rows), so once you find what you're looking for, there is no context about what happened just before or after.
There is also no color coding. I mean, come on, it's 20-fricken-23. 😿
They are hard to copy from
Ok, so let's say that you did manage to find an ID or something else you were seeking. Now you just want to copy and paste it somewhere else. Intuitively, you click and drag your mouse pointer over the ID, but to know avail.
The text is not selectable, you have to click it to open a modal, then select your text and copy. It may not seem like such a big deal if you just need to copy one or two things, but imagine if you had to do this 30 or 40 times!
Plus, you want to copy the entire log to a text file? To my knowledge, this is impossible from the Dev Console
They are often truncated
I regularly search for information that I am logging only to find that the log has been truncated in the Developer Console. This can happen when the action created or modifies records, which runs triggers which might update other records, which might run more triggers, and so on. The cumulative log file can grow so large that the Dev Console will have to truncate it so it doesn't choke on it.
They are volatile
What if you need to keep that log around for a while. As I previously mentioned, there is no way to copy/paste the whole log to a text file, and the logs will only stay in the Dev Console for a maximum of 24 hours.
The Solution
SFDX to the rescue!
SFDX has a command to print the tail of the Apex log to the output (sdout) in your console. I'm sure a lot of folks already know this, but I am constantly surprised by the number of Salesforce dev's that don't.
💡
Don't Have SFDX installed? You can download and install it here
Here's the command:
sfdx force:apex:log:tail -u <YOUR_SFDX_ALIAS>Just replace <YOUR_SFDX_ALIAS> with, the SFDX alias for the org/sandbox you want to see logs from.
If you can't remember your alias(es), you can find them with this command:
sfdx force:org:listThe output should look something like this:
   ALIAS                  USERNAME                           ORG ID             CONNECTED STATUS
 ─ ────────────────────── ────────────────────────────────── ────────────────── ─────────────────────
   dev-ed-cdb-demo-1      devorg1@codebycody.com             00DDn00000ACavoMAD Connected
   dev-ed-codebycody      cody@codebycody.com                00Di0000000a5BrEAI Connected
Give it a Try
Running this command should do basically nothing at first. However, you may notice that you don't get a new "prompt". That's because your terminal is waiting, watching for the Apex Log goodness that it's about to receive.
Now, go do something that will result in an apex transaction. You should see your terminal start streaming the log output. Depending on how busy the servers are at the moment, it can sometimes take up to 5 seconds for it to show up, but it usually takes no more than a second or 2.
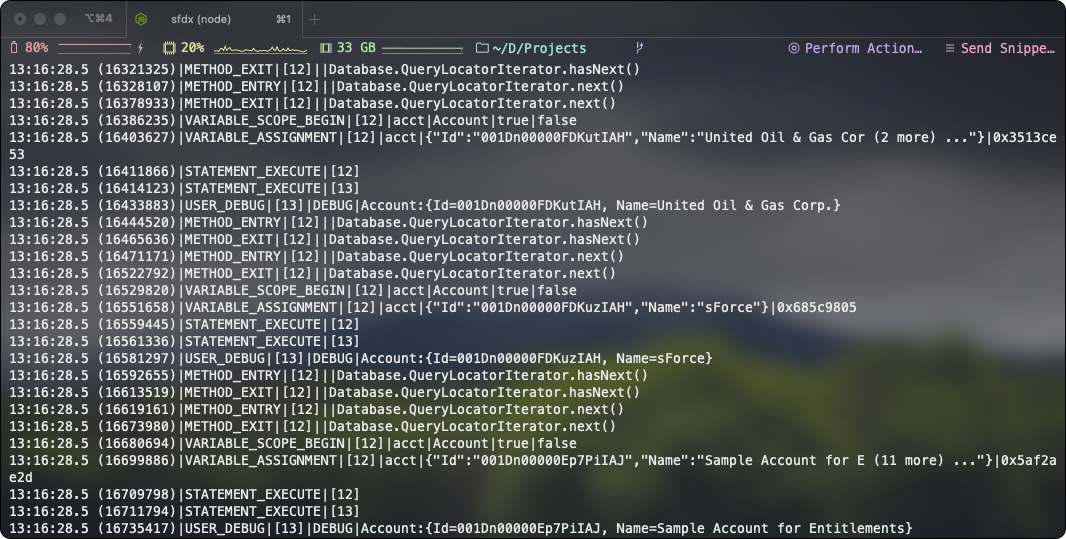
Or if you prefer to see a colorized version, simply add a -c argument
sfdx force:apex:log:tail -c -u <YOUR_SFDX_ALIAS>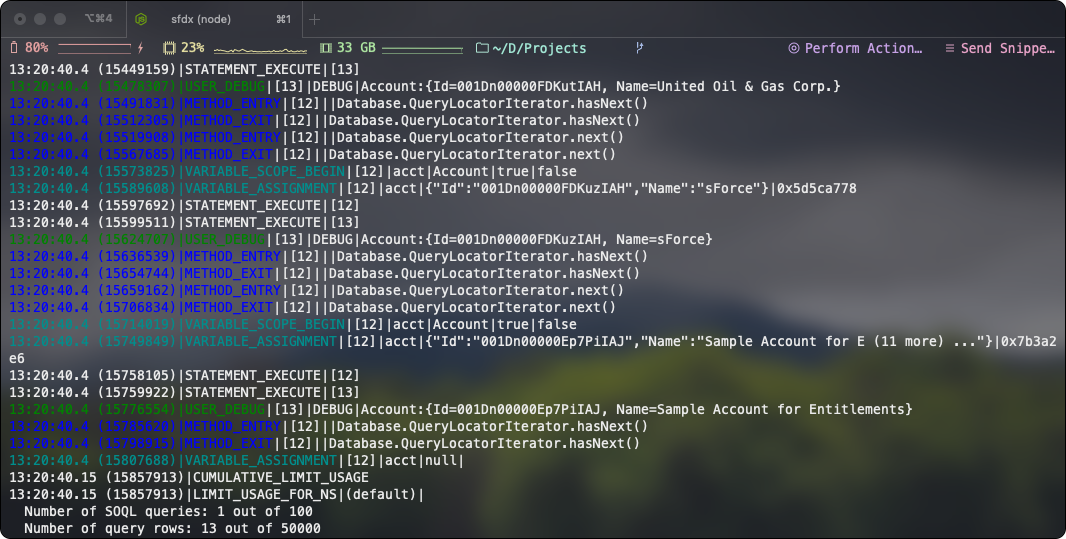
A full list of command arguments and what they are used for can be found in Salesforce's CLI Docs.
...But WAIT, there's more!
We've just scratched the surface of how powerful this can be. Now that we have sdout streaming the logs, we can start to pipe it to other tools, or redirect it to a file.
For example:
Grepping the output
This command will show you only the lines that have the word "Account" in them (similar to the "filter" feature in the Dev Console)
sfdx force:apex:log:tail -u <YOUR_SFDX_ALIAS> | grep Account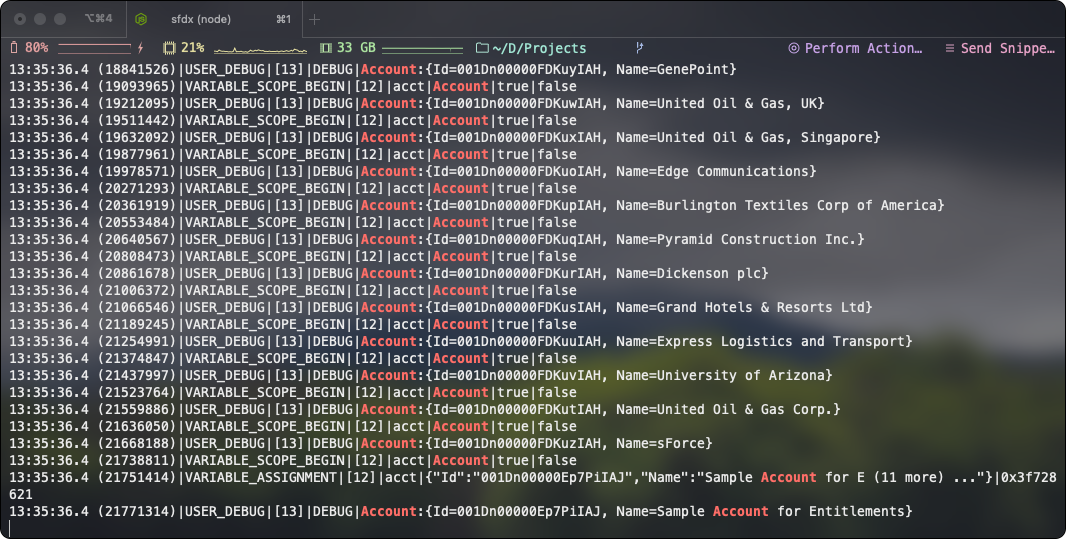
This will show you only user debug statements (similar to the "Debug Only" feature in the Dev Console).
sfdx force:apex:log:tail -u <YOUR_SFDX_ALIAS> | grep USER_DEBUG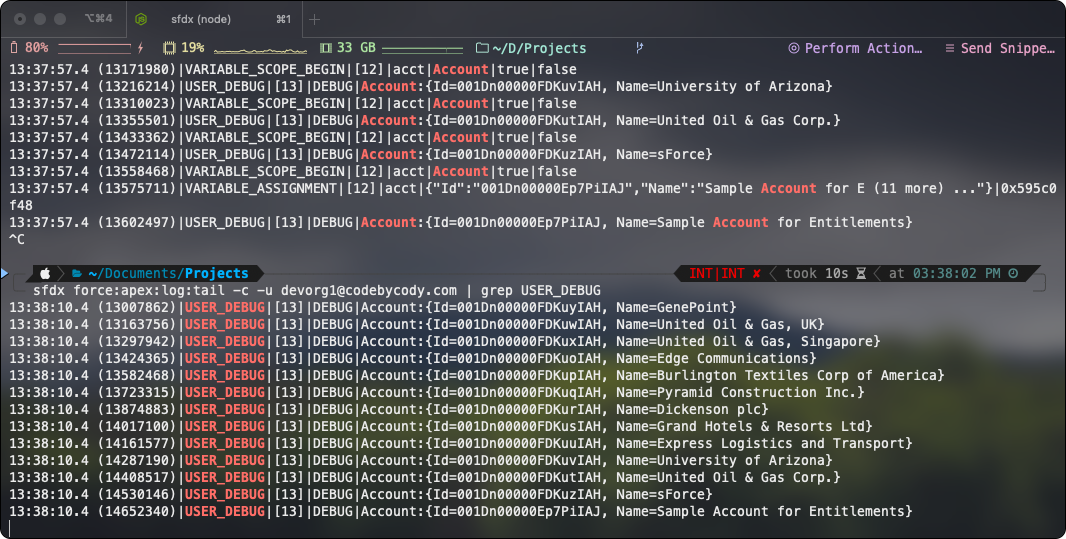
💡
You can basically pipe to just about any software on your machine like grep, ripgrep, awk, wc, or whatever
Redirecting to a file
Now to get around the short life span of a log, and to make it easier to search, let's drop the pipe and redirect the output to a file using >
This command will send the log output to a file called apex.log in your current directory. If the file does not already exist, it will create it for you.
sfdx force:apex:log:tail -u <YOUR_SFDX_ALIAS> > apex.log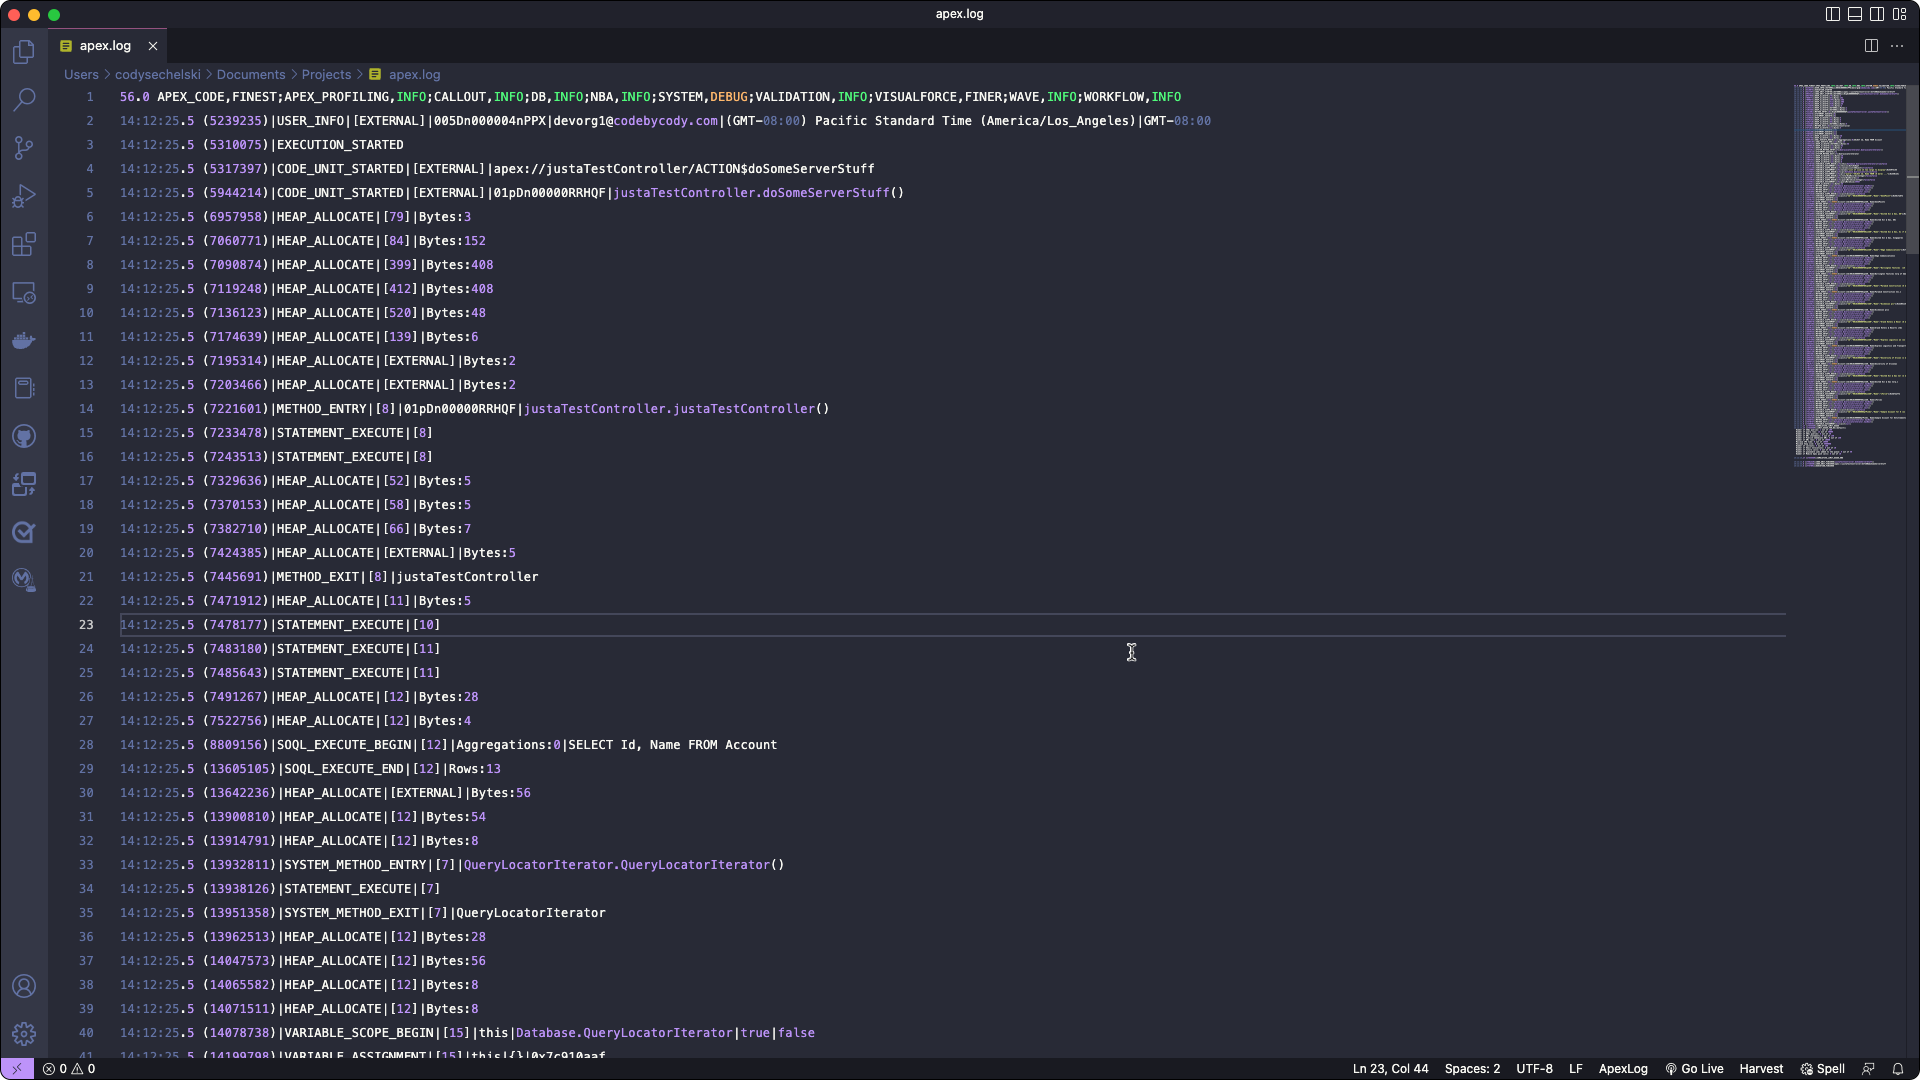
Now we're talking! You can name it anything you like, but by making the extension .log in stead of .txt, it tells out text editor to color code it like a log file. You can now ctrl+p till your heart's content, save it an archive, or build some elaborate script to read and parse bits that are important to you.
Bonus Tip
If you are using VS Code, you can direct the output directly to a VS Code tab. The benefit is this is that it's not technically saved anywhere so at the end of the day, you don't have to go find and delete all of the log files that you no longer need.
For newer version of VS Code:
sfdx force:apex:log:tail -u <YOUR_SFDX_ALIAS> | code -For older version:
sfdx force:apex:log:tail -u <YOUR_SFDX_ALIAS> | code💡
NOTE: Each time a new log is created, it will append to the end of the file. If you find that the log file is filling up, simply select all, delete, and save.
My Setup
For me, I almost always send the output directly to a VS Code tab, or a file that I open in VS Code. Like I mentioned earlier, keeping my flow going is a big deal for me and if I can minimize the number of times I have to bounce my eyes from one window to another, I will be able to stay more focused.
If I choose to store logs in a file, I will create a folder called logs in the root of my project (outside of the force-app directory), and make sure my .gitignore file is ignoring it so it never gets committed to source control. I will create my log file(s) there and every so often I will just delete any old logs as I see fit.
Final Thoughts
As we move away from "the bad old days" of Eclipse and the Developer Console being our only tools, I am really glad that the SFDX team included this feature. It's just one less thing I have to open the Dev Console for. And that makes me happy 🥳
I hope yall enjoyed the read and I'd love to hear your thoughts in the comments below.
